Introduction
Every plant manager knows the specific frustration of a line that is running but not producing. Walk the floor and every station looks busy. The machines are humming and the operators are active. Yet at the end of the hour, the pallet count is five units short of the target.
What follows is usually a series of fragmented investigations. The maintenance team checks their machine logs and finds nothing wrong. The quality team verifies that parts are within tolerance. The production manager looks at the schedule to see if the mix was the issue. By the time anyone figures out exactly where the flow was restricted, the shift is already half over and the throughput is lost for good.
This is the reality of a factory without real time bottleneck detection in manufacturing. The data to find the problem existed the whole time. Because it was siloed, the constraint remained invisible until it was too late.
What a Manufacturing Bottleneck Actually Is
To solve the problem, precision about what it actually is matters. A manufacturing bottleneck is any stage, resource, or process in a production system whose limited capacity constrains the overall throughput of the entire operation.
This is not a new concept. It originates from Eliyahu Goldratt’s Theory of Constraints, which established that a factory is only as fast as its slowest process. Improving the speed of a machine that is not the bottleneck achieves zero improvement in overall throughput. It simply builds up more work in progress inventory in front of the constraint. This is why manufacturing bottleneck analysis is not just a useful exercise. It is the only starting point that actually moves the needle on the bottom line.
Why Bottlenecks Are So Difficult to Find Without Data
If bottlenecks were static, they would be straightforward to fix. In a modern plant, they are moving targets. There are three main reasons why production bottleneck identification fails when done manually.
They Shift What constrains output on the morning shift may not be the same constraint in the afternoon. A change in raw material quality, a slightly slower operator, or a machine deviation caused by ambient conditions can cause the bottleneck to migrate from one station to another in minutes. A static analysis will always miss a shifting bottleneck.
They Are Invisible A machine can be running at full speed and still be the bottleneck. If it is feeding into a downstream process with even slightly lower capacity, it creates a cascading queue that looks like a storage or housekeeping issue rather than a manufacturing process bottleneck. The constraint is real. It simply does not look like one to the naked eye.
They Compound A minor 5% capacity gap does not just slow things down by 5%. It creates a cascading delay that multiplies as it moves downstream, accumulating into hours of lost throughput by the time it becomes visible at the end of the line.
Analysing production data, specifically throughput rates, cycle times, and inventory levels, is the only way to detect these manufacturing process bottlenecks with any reliable degree of accuracy.
How Data Intelligence Detects Bottlenecks in Real Time
Standard reporting tells operations teams that a bottleneck existed yesterday. Real time bottleneck monitoring tells them that one exists right now. Bottleneck detection in manufacturing using data intelligence follows a four stage process that removes the guesswork entirely.
Stage 1: Continuous Data Collection
Data intelligence platforms pull throughput rates, cycle times, machine utilisation, and queue depths from every station simultaneously. This is not a sample or a manual observation. It is a continuous stream of operational data from every PLC and sensor on the line, updating in real time.
Stage 2: Utilisation Based Bottleneck Analysis
A production throughput bottleneck is the station defining the productivity of the entire system. Data intelligence identifies this by analysing utilisation patterns across the full production flow. When one station is running at full capacity while downstream stations are sitting at 70% utilisation waiting for parts, the platform flags the constraint automatically without requiring a human to piece together the picture.
Stage 3: Shifting Bottleneck Detection
Unlike a human observer who can only be in one place at one time, a data intelligence platform monitors the entire line simultaneously. It detects shifting bottlenecks, those that move across the floor as production mix or machine conditions change, and tracks them continuously as the shift progresses.
Stage 4: Root Cause Correlation
Once the location of the bottleneck is identified, the system finds the reason behind it. It correlates the constraint against machine health data, operator performance, raw material quality, and scheduling patterns. The question moves from where the bottleneck is to why it exists and what needs to change to resolve it.
What This Looks Like in Practice
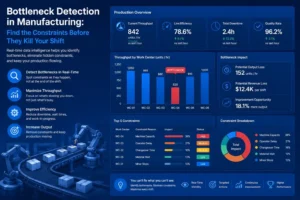
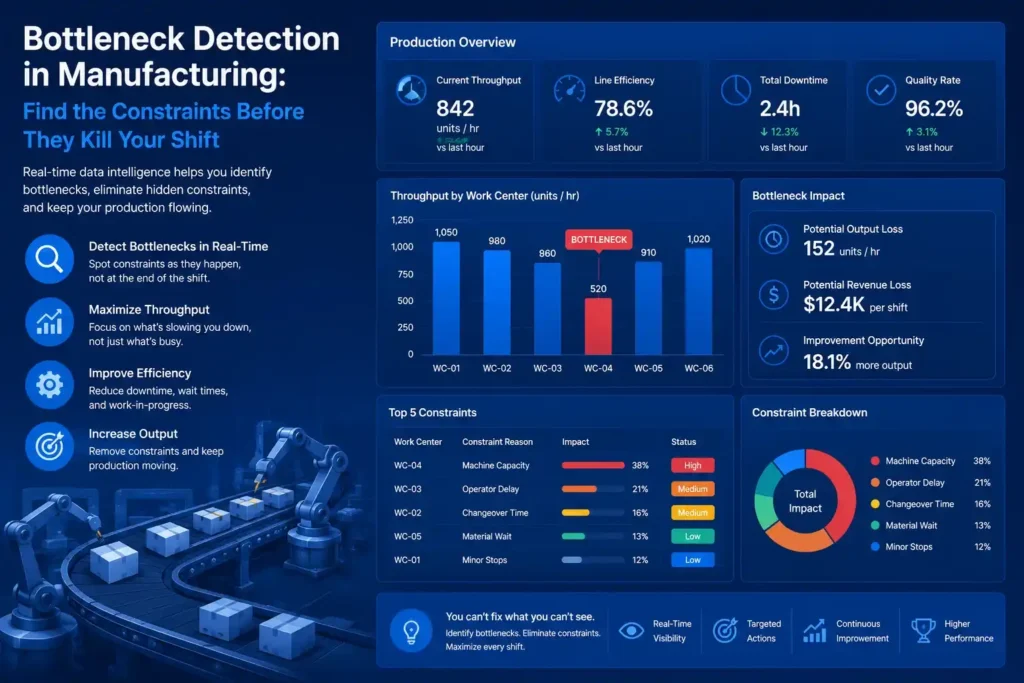
Consider a five stage assembly line consistently missing its daily target. To the naked eye, the line looks fully operational. A real time bottleneck monitoring platform reveals a different picture. Station 3 is operating at 97% utilisation while Stations 4 and 5 are sitting at 71% and 68% respectively, waiting for output.
The bottleneck is confirmed at Station 3. Root cause analysis then reveals that a single sub process at that station has a cycle time 18% longer than its design specification due to a tooling wear issue. The machine was not broken. It was simply running slower than it should have been. The tooling is adjusted during a scheduled 15 minute break and by the afternoon shift, throughput across all five stations has recovered to target. That is how data intelligence reduces production bottlenecks in practice.
The Business Impact of Faster Detection
The business case for bottleneck detection in manufacturing is direct and measurable. Research has demonstrated that implementing data driven bottleneck detection leads to an over 30% gain in Overall Equipment Effectiveness in complex manufacturing systems.
Every hour a bottleneck goes undetected is an hour of compounding throughput loss that cannot be recovered. Faster detection means faster resolution. This translates directly into more units produced per shift, more deliveries met on time, and margin protected across every production cycle. Manufacturers who move from manual observation to factory throughput analytics do not just find problems faster. They surface the silent constraints that manual observation would never detect at all.
Frequently Asked Questions
1. What is bottleneck detection in manufacturing?
It is the process of identifying the specific stage, resource, or process in a production system that is limiting the total output of the entire operation. Accurate bottleneck detection ensures that improvement efforts are focused on the one constraint that actually determines overall throughput.
2. How does data intelligence detect production bottlenecks in real time?
It monitors the utilisation rates and cycle times of every machine simultaneously. When one station is running at maximum capacity while downstream stations are waiting for output, the platform automatically identifies and flags that station as the active bottleneck.
3. What is the difference between a sole bottleneck and a shifting bottleneck?
A sole bottleneck is a permanent constraint, such as a process stage that is structurally undersized relative to the rest of the line. A shifting bottleneck moves based on variables such as product mix, operator performance, or machine health and requires continuous real time monitoring to track reliably.
4. How does bottleneck detection improve manufacturing throughput?
By ensuring that maintenance, optimisation, and operational efforts are concentrated on the one stage that is actually constraining the rest of the plant. Improving any stage that is not the bottleneck delivers no improvement to overall throughput.
5. What data does a bottleneck detection platform use to identify constraints?
It primarily uses cycle times, throughput counts, and machine utilisation rates pulled directly from PLCs and IoT sensors across the production line, combined with machine health data, queue depths, and inventory levels at each stage.
Conclusion
Every production line has a bottleneck. The only question is how long it takes to find it. If it takes four hours to identify a constraint, half a day of production is already lost. If it can be found in four minutes using factory bottleneck analytics, the shift is saved.
Manufacturing throughput optimisation is not about making every machine run faster. It is about making sure the right machine never stops. Data intelligence closes the gap between a constraint forming and a team resolving it, turning what used to be a half day investigation into a four minute automated alert.
Ready to see the constraints holding back your production floor? Discover how MyDataInsights helps manufacturers detect, diagnose, and resolve bottlenecks before they cost the shift.