The bottom line
If your business runs on SAP, Excel files, and gut feel - you're not behind because you lack data. You're behind because your data doesn't talk to each other. Microsoft Fabric was built to solve exactly that: a unified platform that closes the loop from raw operational data through to AI-driven automation, in a single governed environment. This post unpacks how that works across three pillars - Data, Insights, and AI & Automation - with a real-world FMCG distributor case running through all three.
In This Article
- 1Three pillars - why they break without a spine
- 2Pillar 1: Data - OneLake as the single source of truth
- 3Real-world scenario: FMCG distributor in the UAE
- 4Pillar 2: Insights - from dashboards to decisions
- 5Pillar 3: AI & Automation - where it gets compounding
- 6The architecture in one view
- 7Closing the loop: from reactive to autonomous
- 8Why this matters more for industrial companies
- 9Where to start
The Three Pillars: Why They Break Without a Spine
Before we get into architecture, let's be honest about where most industrial companies actually sit. Data: it should be unified, governed, and real-time. In practice it's siloed CSVs, SAP extracts, and manual pulls. Insights: it should be trusted dashboards and self-serve analytics. In practice it's multiple versions of truth and Excel wars. AI & Automation: it should be predictive models and autonomous actions. In practice it's one-off ML experiments with no deployment path.
The gap between what these pillars should look like and what they actually look like is not a technology problem. It's an architecture problem. And Microsoft Fabric is the architectural answer - not as another BI tool, not as a cloud storage upgrade, but as a unified data platform that closes the loop from raw operational data all the way through to AI-driven automation.
The gap between data and autonomous action is not a technology problem. It is an architecture problem. Microsoft Fabric is the architectural answer.
Pillar 1: Data - OneLake as the Single Source of Truth
At the core of Microsoft Fabric is OneLake - a single, logical data lake that spans your entire organisation. Think of it as OneDrive, but for structured and unstructured enterprise data. Every workload in Fabric - lakehouses, warehouses, real-time analytics, pipelines - reads from and writes to OneLake. There is no data movement between services, which eliminates the replication overhead that plagues legacy architectures.
The Lakehouse (Delta Parquet) is the primary storage layer. Data lands in Delta format, giving you ACID transactions, time-travel, and schema enforcement on a data lake — without the brittleness of a traditional warehouse. Fabric Data Factory is the native ETL engine, with first-party connectors for SAP HANA, SAP Table (covering S/4HANA and ECC application layer), SAP BW and BW Open Hub, SAP CDC (ODP) and SAP Datasphere. SAP Business ByDesign is consumed via the generic OData connector. Dynamics 365, Oracle, on-prem SQL, REST APIs, flat files and several hundred other sources are also covered. Low-code pipelines with Dataflow Gen2 handle transformation logic.
Synapse Spark handles large-scale data processing, complex joins, and ML feature engineering - running on the same OneLake data with no copy required. An SQL Endpoint is auto-generated for every Lakehouse, so any tool that speaks T-SQL (Power BI, SSMS, dbt, your analyst's query tool of choice) can query it directly. Real-Time Analytics (Kusto/KQL) handles streaming ingestion from IoT sensors, SCADA systems, or event hubs at sub-second latency.
Practically, this means your SAP data, your Excel planning files, your IoT sensor readings, and your ERP transactions all land in one place - in real time, automatically, with no manual exports. Your IT team stops being a data shuttle service. Your analysts stop arguing about which spreadsheet is correct. Your operations team sees a single version of inventory, production output, and demand - updated continuously.
OneLake eliminates the replication overhead that plagues legacy architectures. One platform, one governed layer - no data movement between services.
A Real-World Scenario: FMCG Distributor in the UAE
This is a composite scenario based on patterns we see across mid-market clients. A fast-growing FMCG distributor in the UAE was running four parallel systems: SAP Business ByDesign for finance and procurement, a homegrown route-management system for van sales, WhatsApp-based order collection from retailers, and an Excel model for demand planning updated weekly by one analyst.
The symptoms were predictable. Month-end close took 9 days because finance had to reconcile SAP against the route data manually. Stockouts hit top-selling SKUs despite holding 6 weeks of average inventory. The distributor sales team had no visibility into which retailers were trending up or down.
We ingested SAP ByD, the route system, and a WhatsApp-to-structured-order pipeline into OneLake via Data Factory. The lakehouse consolidated approximately 4 years of transaction history in Delta format. Real-Time Analytics captured daily van sales as they happened. Within eight weeks, the team had a unified data layer. Month-end close dropped from 9 days to 2 days. But more importantly - the foundation was set for Pillars 2 and 3.
Month-end close dropped from 9 days to 2 days - not from better ERP configuration, but from building the unified data layer that should have existed from the start.
Pillar 2: Insights - From Dashboards to Decisions
Once data is in OneLake, Fabric's analytics layer kicks in. Power BI in Direct Lake mode is the game-changer. In traditional Power BI, you import data into a dataset or use DirectQuery - which is slow. In Fabric, Power BI reads Delta files directly from OneLake at near-import speed. No dataset duplication, no scheduled refresh lag. Your dashboard reflects data as it lands.
The Semantic Model (formerly Dataset) is a governed business logic layer sitting above the Lakehouse. Metrics, KPIs, and hierarchies defined once and used everywhere - in Power BI reports, Excel, Teams, and Copilot responses. Analysts and data scientists query the same data with familiar T-SQL via the SQL Analytics Endpoint. Notebooks (Spark/Python) handle ad hoc exploration, cohort analysis, or preparing training data for ML models, with outputs writing back to OneLake.
Power BI on Fabric is not just faster dashboards. It's the end of the "which number is right?" meeting. Because every report reads from the same OneLake, the inventory figure in the Operations dashboard matches the inventory figure in the Finance dashboard - because it is the same data. One semantic model, governed centrally, consumed everywhere. Self-serve analytics becomes real because analysts aren't waiting for IT to refresh a dataset. They're writing SQL or dragging fields in Power BI against live data.
Back in the UAE distributor scenario: with the unified data layer in place, we built a Distributor Performance Dashboard in Power BI Direct Lake mode. For the first time, the sales director could see revenue by route, by SKU, by retailer - updated daily by 7am. Sell-through velocity versus inventory coverage by SKU. Which retailers had gone silent (no orders in 14+ days). The demand planning analyst - who had been spending 4 days a week maintaining an Excel model - switched to a Fabric Notebook that auto-calculated 13-week rolling forecasts every Monday morning, publishing outputs directly into Power BI. Forecast accuracy went from approximately 62% to 81% in three months.
Self-serve analytics becomes real when analysts query live data directly - not when they wait for IT to refresh a dataset that was already stale.
Pillar 3: AI & Automation - Where It Gets Compounding
This is where Fabric shifts from a data platform to a competitive moat. The same OneLake that powers your dashboards feeds your AI and automation layer. ML models via Synapse Spark and MLflow let you train forecasting models (demand, churn, yield), anomaly detection models (quality defects, machine health), or classification models (customer segmentation) directly on Lakehouse data. Models are registered and versioned via MLflow, tracked within Fabric.
Microsoft Copilot for Fabric enables natural language querying over your semantic model - "What were our top 10 SKUs by revenue growth last quarter in the Northern region?" - answered in seconds, no SQL required. Power Automate and Power Apps connect via the Dataverse connector to trigger business workflows from model outputs: a stockout prediction fires a reorder request in SAP, an anomaly in production yield triggers a maintenance ticket, a high-churn retailer score routes a task to the account manager.
Azure OpenAI integration handles document intelligence (invoice processing, quality report extraction), copilots embedded in internal apps, or retrieval-augmented generation over your enterprise knowledge base. Eventstream and Data Activator (formerly Reflex) provide event-driven automation. When a KQL query detects that a production line's OEE drops below threshold, Data Activator fires a Power Automate flow automatically — without human intervention.
This is the shift from reactive to autonomous operations. Most manufacturing and FMCG companies today are reactive: the stockout happened, now we fix it. The quality failure was logged, now we investigate. Fabric's AI layer inverts this. The model predicted the stockout 12 days out. The anomaly was flagged before the batch was released. And because the AI lives in the same platform as the data and the dashboards, your data engineers, analysts, and business users work in one environment - not five different vendors with five integration contracts.
When the AI lives in the same platform as the data and the dashboards, you don't need a separate "AI team" maintaining separate systems. The model that was trained is the same one the automation calls at 6am.
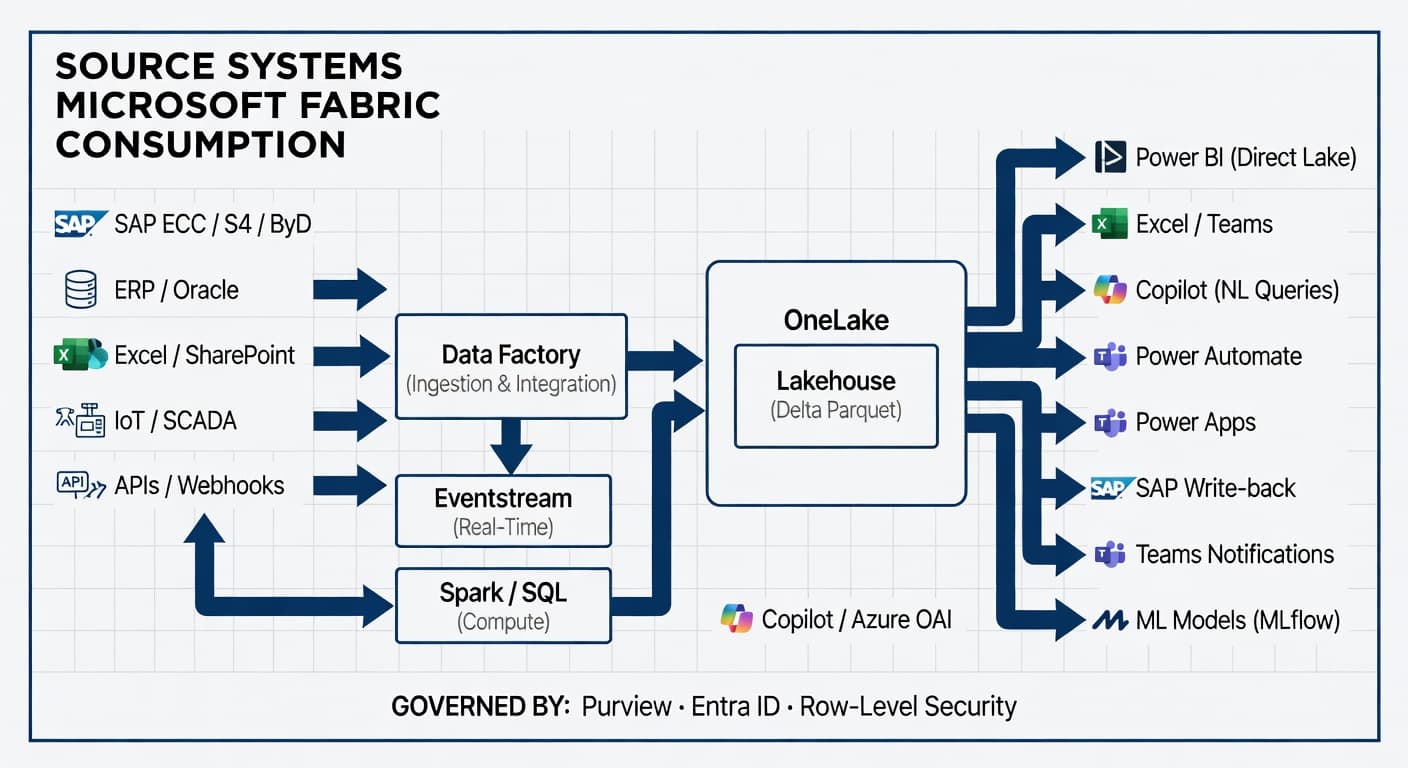
The Architecture in One View
The diagram below shows the full Microsoft Fabric architecture - from source system ingestion through OneLake to every consumption layer, governed centrally by Purview, Entra ID, and Row-Level Security.
Closing the Loop: From Reactive to Autonomous
Six months after initial deployment, the UAE distributor had moved from reactive to proactive across every major operational domain. The Demand Forecasting Model, built on Spark and MLflow and trained on 4 years of daily sales history with seasonal patterns and promotions, loaded outputs into a Fabric table every Monday. The demand planner reviewed exceptions only - 90% of SKUs were auto-approved.
A Retailer Churn Early Warning model flagged retailers with declining order frequency 3 weeks before they fully lapsed. The sales supervisor received a daily alert in Power BI, with a pre-populated outreach list in Power Apps. An Automated Reorder Trigger - built on Eventstream, Power Automate, and the SAP ByD connector - created a purchase requisition in SAP ByD automatically when inventory coverage for a fast-mover dropped below 10 days of stock. No human keystroke required.
The net result over 12 months: stockout incidents down 74%. Inventory days-on-hand reduced from 42 to 31. Analyst headcount for routine reporting effectively zero - redeployed to commercial analytics. The sales team now closes retailer gaps they would never have caught manually.
Stockout incidents down 74%. Inventory days-on-hand from 42 to 31. Analyst time on routine reporting: zero - redeployed to commercial work. That is the compounding effect of closing the loop.
Why This Matters More for Industrial Companies Than Anyone Else
SaaS companies can stitch together five different point tools and call it a data strategy. Industrial companies cannot. Your data is messier - batch extractions from on-prem SAP, flat files from 15-year-old MES systems, sensor data in proprietary formats. Your compliance requirements are stricter - especially if you're in food safety, pharma, or aerospace. Your IT teams are smaller and more stretched.
Microsoft Fabric's unified architecture means you don't need five different vendors, five integration contracts, and a data engineering team of ten. You need one platform, governed centrally, with a clear path from ingestion to insight to action. That's what makes it a genuine enterprise platform for manufacturing and FMCG - not just another analytics tool.
Industrial companies can't afford fragmented data stacks. Fabric's unified architecture - one platform from ingestion to autonomous action - is designed for exactly this environment.
Where to Start
You don't need to boil the ocean. In our experience, the fastest ROI comes from a focused first build. Pick one data domain - inventory, demand, production yield, or distributor performance. Ingest two or three sources - typically SAP plus one operational system plus Excel. Build one trusted dashboard in Power BI Direct Lake. Identify one automation trigger - a threshold, an anomaly, a weekly exception report.
Done right, this is an 8–12 week engagement. The foundation you build in that window supports everything that comes after - the ML models, the copilots, the autonomous workflows. The manufacturers and distributors who win the next decade won't be the ones who bought the most software. They'll be the ones who built a data foundation early enough to let AI compound on top of it.
The manufacturers and distributors who win the next decade won't be the ones who bought the most software. They'll be the ones who built a data foundation early enough to let AI compound on top of it. Microsoft Fabric is the fastest path to that foundation for companies in your industry. If you're evaluating Fabric for your organisation, or you're already on the journey and hitting architecture questions - I'd love to hear where you're stuck.
Free Assessment
Where does your operation sit on the data maturity curve?
8 questions. 3 minutes. You get a scored breakdown across data infrastructure, analytics readiness, and automation potential — with a specific next step for your industry.