The bottom line
Most mid-market FMCG forecasting plateaus are not a model problem — they are an override pipeline problem. Four moves shift accuracy 8–10 points in six months with no platform change: wire retailer sell-out alongside SAP shipment data, treat promotions as their own forecast, put Forecast Value Added on the S&OP wall, and unify the data foundation in OneLake before optimising the model.
In This Article
- 1I used to think this was a tooling problem
- 2Where the plateau actually sits
- 3The four moves that actually shift the number
- 4Move 1 — Sell-out beats sell-in, at the right echelon
- 5Move 2 — Promotion forecasting is the largest single lever
- 6Move 3 — Forecast Value Added, the cheapest S&OP diagnostic
- 7Move 4 — The data foundation, not the model
- 8Where ML forecasting still fails
- 9So what — for the senior buyer
I Used to Think This Was a Tooling Problem
Most FMCG forecasting projects do not fail at the model. They fail at the override pipeline sitting on top of it.
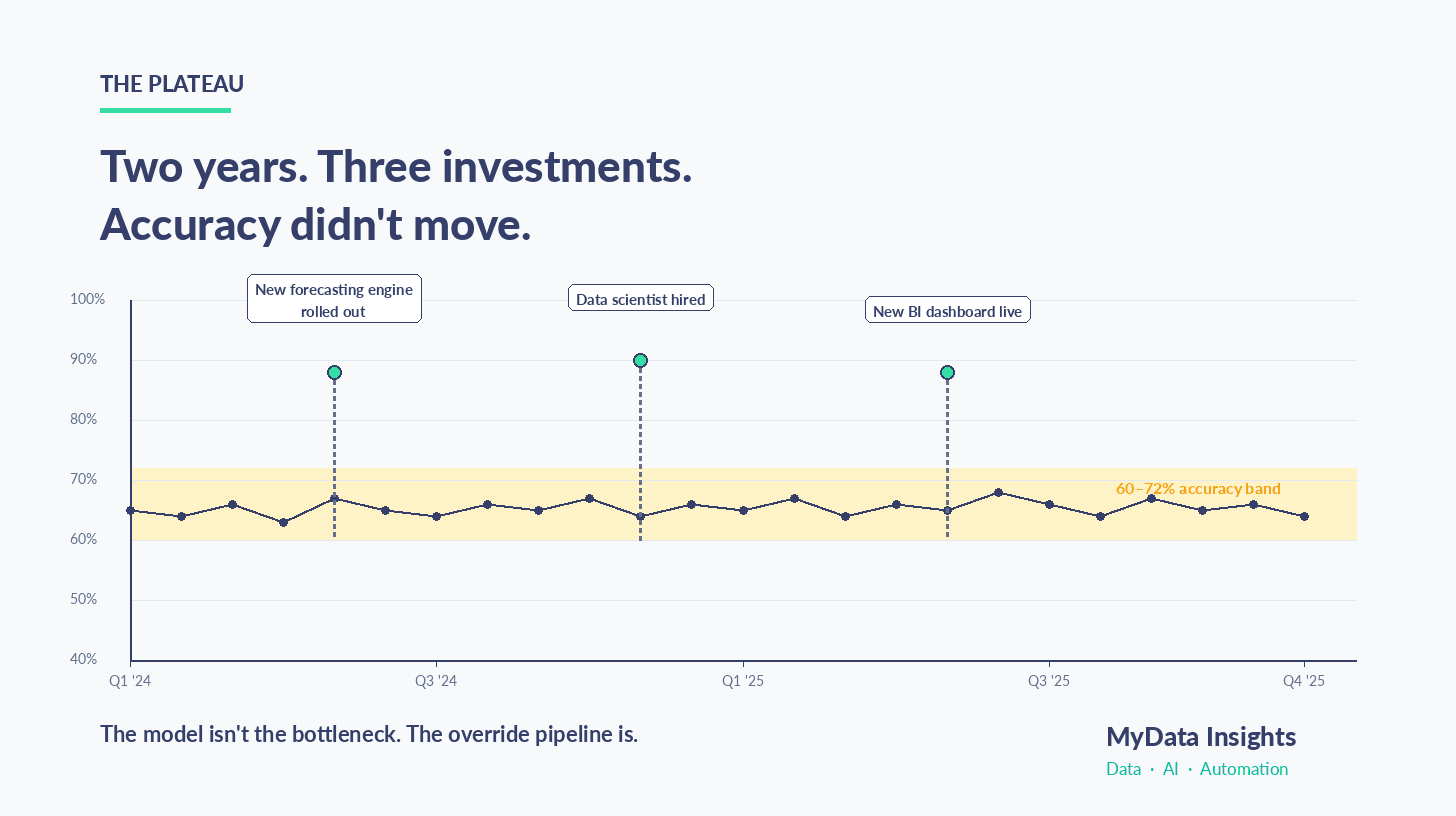
Every six months I get a version of the same call. The mid-market FMCG client has bought new demand planning software. The data scientist is in seat. The Power BI dashboard is green. And the SKU-DC weekly forecast accuracy is still 64%.
The model is not the bottleneck. I will prove it.
For most of the last decade I believed forecast accuracy was a platform fight. Buy a better engine — ToolsGroup, RELEX, o9, Blue Yonder, the SAP IBP build, the Microsoft Fabric and Power BI stack, take your pick — and the numbers would move. I had spent enough years inside Accenture and EY data practices to believe that platform choice was the lever.
It is not. Not the main one.
The published research is honest about this in a way the vendor decks are not. Oliver Wight's own demand-planning practice argues there is no such thing as a universal benchmark — only what is defensible for your category, footprint and channel mix. The Institute of Business Forecasting's 2023–2024 cross-industry data puts CPG forecast error in the high twenties to high thirties MAPE, with the spread between top quartile and lagging quartile sitting almost entirely at SKU level, not at brand level. Gartner's published food and beverage median is around 25% MAPE at aggregate — i.e. roughly 75% accuracy — and at SKU-DC weekly, materially worse.
Here is the piece of peer-reviewed evidence that should change how every Supply Chain Head approaches this. Fildes, Goodwin, Lawrence and Nikolopoulos, working across more than 60,000 statistical forecasts inside four real supply-chain businesses, found that roughly half of judgmental planner overrides made forecasts worse, not better. Positive (upward) adjustments — the kind your sales team applies every Monday — were systematically the most destructive.
That single finding reframes everything. The model is not the bottleneck. The override pipeline layered on top is.
Roughly half of judgmental planner overrides make statistical forecasts worse, not better. Positive sales-team adjustments are systematically the most destructive — Fildes et al., International Journal of Forecasting 2009.
Where the Plateau Actually Sits
A few weeks ago I sat through a diagnostic with a packaged-foods business in the Gulf. Five plants, three warehouses, twenty-six countries on the distribution list. They had migrated to SAP S/4HANA the previous year, stood up Power BI demand-planning dashboards on top, and hired a data scientist. The CIO and the Supply Chain Head were in the room together — which is rarer than it should be.
Their SKU-DC weekly forecast accuracy was 64%.
The CIO opened with the question I get most often. "Which forecasting engine should we move to?"
That was not the right question. Their model was not the constraint.
What I asked instead — and what every Supply Chain Head should ask before approving the next vendor proof-of-concept — was what their planners actually did each Monday morning. The answer was what you would expect. Pull the statistical baseline out of SAP IBP. Export to Excel. Apply four to six weeks of sales adjustments. Re-import. Run the consensus meeting. Adjust again. Send to S&OP.
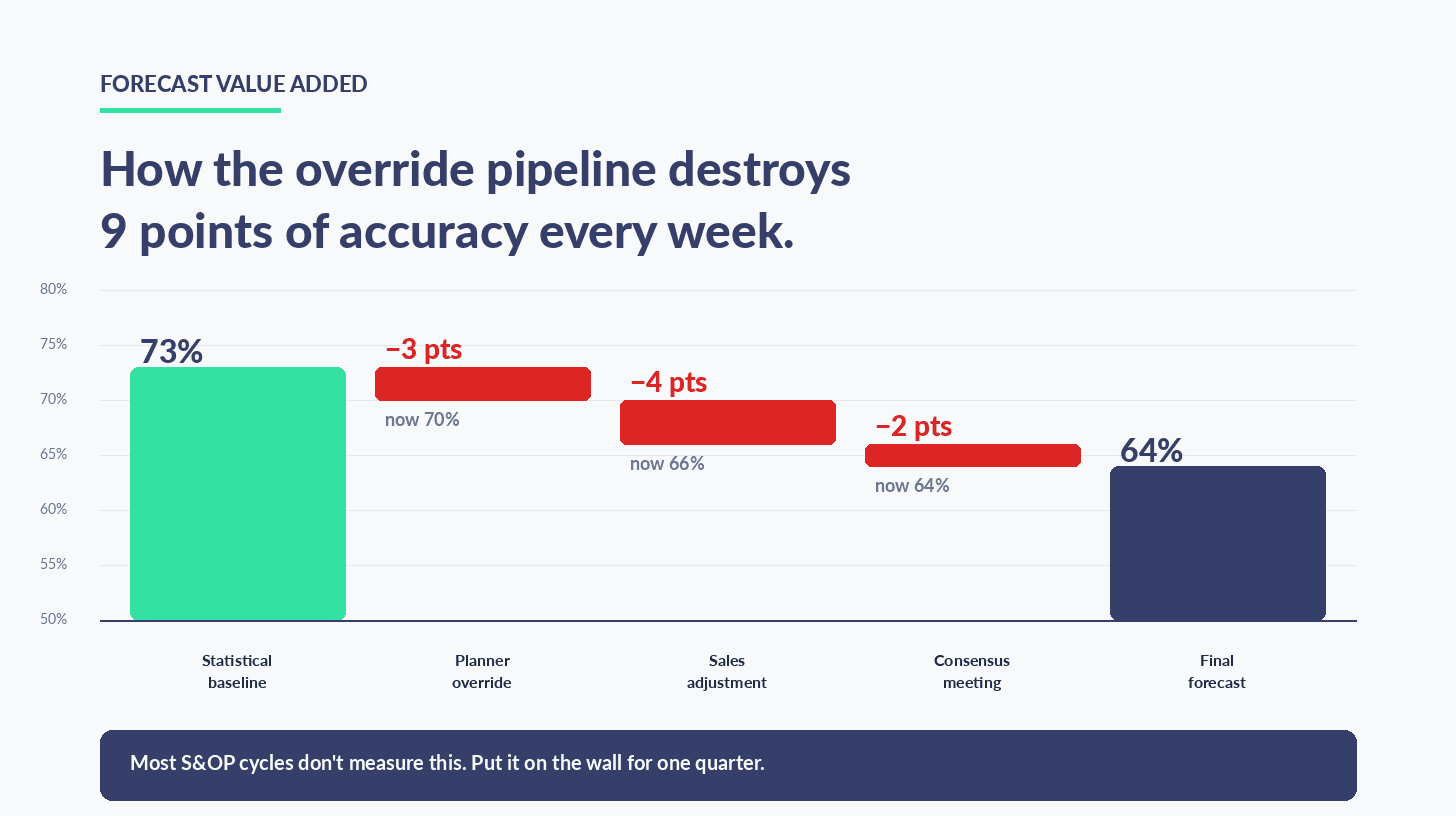
The model was not producing 64% accuracy. The model was producing somewhere close to 73%. The planner-override pipeline was destroying nine points of accuracy every week.
This is not unusual. It is the median FMCG operation.
Statistical baseline 73% → planner override → sales adjustment → consensus meeting → 64% final forecast. Nine points of accuracy destroyed every cycle. Most S&OP teams never measure it.
The Four Moves That Actually Shift the Number
Across the FMCG and packaging programmes I have sat inside since 2019, four moves have measurably shifted SKU-DC weekly accuracy. None of them is "buy a transformer model."
Unify the data. Predict with AI. Act with automation. In that order — always.
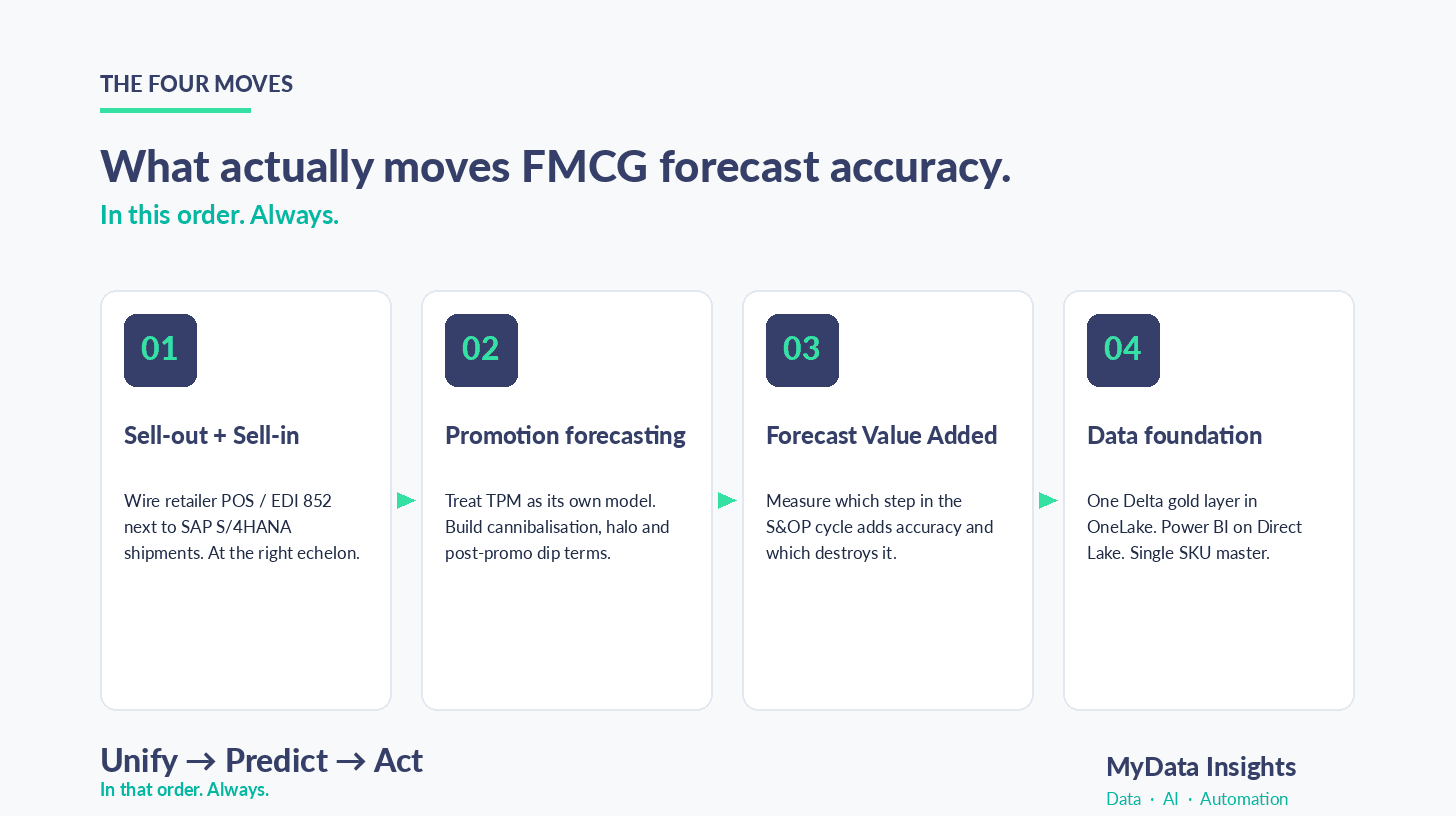
Move 1 — Sell-Out Beats Sell-In, at the Right Echelon
The single biggest data move in FMCG is wiring retailer POS / sell-out data into the planning loop alongside the SAP shipment stream. Not as a replacement — as a paired signal.
The peer-reviewed result is sharper than the vendor pitch. Abolghasemi, Rostami-Tabar and Syntetos, working across 684 series in the International Journal of Production Research, showed that at the manufacturer level, order-based forecasts beat POS-based forecasts by 6–15% MAPE. The upstream signal is what you actually ship. POS only wins downstream, on shorter horizons, and on promotion-heavy SKUs.
So the architecture matters. POS belongs at the SKU-store / DC level on 0–4 week horizons. ERP shipment data stays at the manufacturer level on the 4–13 week plan. Most demand-sensing pitches conflate the two and oversell the result.
For mid-market FMCG, this is usually the difference between a 64% number and a low-seventies number on the top 200 SKUs. Not 30%. Not 50%. Eight to ten points, real, on the part of the catalogue that actually matters.
Move 2 — Promotion Forecasting Is the Largest Single Lever You Are Not Pulling
The published spread between leading and lagging quartiles of promoted-SKU forecast accuracy is the largest of any category in the industry data — roughly thirty points. Trapero, Pedregal, Fildes and Kourentzes demonstrated the structural bias years ago: promotional periods are systematically under-forecast, and the post-promotion dip is systematically over-forecast. Both directions, every cycle.
Most TPM systems still bolt a flat uplift factor on top of the baseline. They do not model cannibalisation across adjacent SKUs. They do not model the halo on un-promoted variants. They do not separate price-led uplift from display-led uplift. They certainly do not model the post-promo dip.
If your team is forecasting promoted-SKU accuracy at 50–60%, you have fifteen to twenty points of accuracy sitting in a trade promotion data integration project — not in a model upgrade.
Promoted-SKU accuracy at 50–60% is the single largest accuracy gap in mid-market FMCG. The fix is a trade promotion data integration project — not a model upgrade.
Move 3 — Forecast Value Added Is the Cheapest Diagnostic in S&OP and the Most Ignored
I have walked into S&OP meetings at FMCG businesses with USD 200M of revenue and never once seen a Forecast Value Added (FVA) chart on the wall.
This is the cheapest diagnostic in operations management. The mechanic is small. For every planning cycle, you measure whether each step — statistical baseline → planner override → sales adjustment → consensus meeting — adds or destroys accuracy. You compare each step against the previous one, and against a naïve no-change benchmark.
Mike Gilliland at SAS, building on the Fildes work, has documented operations where roughly half of forecasts at granular SKU level are worse than a naïve random walk. Practitioners flag this constantly. It is in almost no S&OP dashboard I have seen in the Gulf or in India.
Put FVA on the wall for one quarter, and you will identify which planner is adding value, which is breaking even, and which is making the forecast measurably worse. The conversation that follows is uncomfortable. It also moves the number.
Move 4 — The Data Foundation, Not the Model
Now the platform argument, because it is the question that pays my bills and the question I push back on most.
A mid-market FMCG business already on a Microsoft estate does not need a Databricks migration to shift forecast accuracy. They need their SAP S/4HANA shipment data, their retailer EDI 852 / Nielsen / Circana sell-out data, and their TPM promotional calendar landed in one place. One Delta gold layer in OneLake. Power BI on Direct Lake on top. A feature store built from those three sources, joined on a single SKU master, with one calendar, refreshed on a cadence that matches the planning cycle.
That is the unglamorous reality.
The Microsoft Fabric vs Azure Databricks vs Snowflake debate, in FMCG demand forecasting specifically, is not a forecast accuracy debate. None of the three platforms gives you a measurable accuracy advantage. The peer-reviewed M5 Walmart competition is the cleanest published reference point: LightGBM with rich features beat the best statistical baseline by 22.4%, used by every one of the top 50 entries. The model choice and the feature engineering matter ten times more than which Spark engine you ran them on.
Choose the platform on ecosystem fit, total cost of ownership, and team skill. Stop choosing it on forecasting capability. That is a marketing argument, not a measured one.
The Fabric vs Databricks vs Snowflake debate, in FMCG demand forecasting specifically, is not a forecast accuracy debate. Choose on ecosystem fit, TCO and team skill — not on a vendor accuracy claim.
Where ML Forecasting Still Fails — and Where I Push Back on Every Vendor in the Room
This is the part most consultancy decks skip. It is also the part Operations Directors most need to hear before signing the SOW.
Even with everything wired correctly — sell-in plus sell-out, TPM integration, FVA on the wall, a clean Delta foundation, gradient-boosted trees with hierarchical reconciliation on top — there are forecast problems that ML genuinely does not solve in 2026. Anyone who tells you otherwise has not shipped one.
New product introductions. Up to 80% of FMCG launches fail commercially. Attribute-based, lookalike-SKU modelling helps. Published case studies show 10–15% NPI MAPE improvement over the naïve baseline. None of them turn NPI into a solved problem. The honest answer on a new launch is a wide range, sized by category history and distribution gain. Do not let anyone sell you 90% NPI accuracy.
Censored demand from stockouts. This one matters more than the industry admits. When your retailer is out of stock for ten days, the POS signal reads zero — and your model learns that demand was zero. INFORMS-published research confirms a systematic downward bias in production ML forecasts that do not correct for stockout censoring. Most mid-market deployments do not correct. Most do not even instrument for lost sales. Their forecast accuracy number is partially fictional and they do not know it.
Channel shift, especially in India. Quick commerce now sits at roughly 35% of FMCG e-commerce in India and is growing 38–40% year on year. If your demand model is trained on traditional general trade plus modern trade Nielsen panels, you are forecasting a market that is structurally smaller every quarter than the one your sales team is actually selling into. Blinkit, Zepto and Instamart data is a separate workstream — not a feature you add later. Legacy FMCG brands are losing shelf-share to D2C in months, not years. The model cannot see what is not in the data.
Self-fulfilling forecasts. Both Lokad and the IBF have documented this loop. The forecast under-estimates. The supply team sizes capacity down. Shelves go empty. The unrecorded lost sales never make it back into the training data. The forecast still looks "accurate." Speak to your demand planners about lost sales. If they cannot put a number on it, your accuracy metric is overstated.
Foundation-model hype. TimeGPT, Chronos, TimesFM and Lag-Llama look great on generic benchmarks. There is — as of mid-2026 — no peer-reviewed FMCG industrial deployment that shows them beating a well-tuned LightGBM baseline on hierarchical retail data. The benchmark wins are real. The mid-market FMCG wins are not yet demonstrated. Treat them as a future R&D track, not a near-term commitment.
So What — For the Senior Buyer
If you are running supply chain at a mid-market FMCG business and your SKU-DC weekly forecast accuracy has been stuck between 60% and 72% for two cycles, the answer is almost certainly not the next forecasting engine. In rough order, it is:
1. Stand up a Forecast Value Added view across your current S&OP cycle. Find out which step in the process is destroying accuracy.
2. Wire retailer POS or scan data into the planning environment alongside SAP shipment data. This typically means an EDI 852 / Nielsen / Circana feed and an honest reconciliation against your SKU master.
3. Treat trade promotion as a separate forecasting problem. Build out cannibalisation and halo terms even if they start as simple lookup tables.
4. Unify the data foundation — one Delta gold layer in OneLake on Microsoft Fabric is the lowest-friction path for a Microsoft estate; Azure Databricks if you are already there. Stop optimising the model before the foundation is in place.
5. Be honest about what you are not solving with ML. New product launches, channel shift, and stockout-censored demand are workstreams in their own right — not features to bolt onto a forecasting tool.
Most mid-market FMCG businesses I work with can move eight to ten points of SKU-DC accuracy in six months with no model upgrade. That is the conversation worth having.
You are not funding a learning exercise.
Most mid-market FMCG businesses can move eight to ten points of SKU-DC weekly accuracy in six months with no model upgrade. That is the conversation worth having.
If you are a Supply Chain Head or Operations Director at a mid-market FMCG, packaging or distribution business — and the SKU-DC accuracy number on your Monday review has not moved for two cycles — that is the diagnostic conversation worth having. 30 minutes with Amit. No slides. No pitch deck. No obligation to proceed. Most operations leaders leave this call with three things they had not considered.
Free Assessment
Where does your operation sit on the data maturity curve?
8 questions. 3 minutes. You get a scored breakdown across data infrastructure, analytics readiness, and automation potential — with a specific next step for your industry.