
The bottom line
You don't migrate away from Power BI — it is a core experience inside Microsoft Fabric. The real question for a manufacturer is whether its data environment has outgrown a Power BI-centric architecture. Seven signs say it has: rising data volume, ERP/MES/IoT/OT silos, Power BI turning into an ETL tool, needing prediction not just dashboards, IT/OT convergence, a data team stuck maintaining pipelines, and preparing for AI. The move is not rip-and-replace — it is giving Power BI a stronger data platform underneath. And you do not migrate everything: modernise what matters, retire what doesn't.
In This Article
- 1When the question changes
- 2You don't leave Power BI
- 3The architecture shift
- 41. Data volume is exploding
- 52. ERP + MES + IoT + OT silos
- 63. Power BI has become your ETL
- 74. You need more than dashboards
- 85. IT and OT must converge
- 96. Maintenance is eating insight
- 107. You are preparing for AI
- 11Power BI vs Fabric: the call
- 12What happens to your reports
- 13Direct Lake for manufacturers
- 14A readiness scorecard
- 15A phased migration strategy
- 16The bottom line
The question changes as you get more data-driven
Power BI has become the analytics backbone for most manufacturers — production performance, OEE, quality, inventory, supply chain, maintenance, sales, finance and plant performance all run through it.
But as a plant gets more data-driven, the challenge stops being "build a better dashboard". Data starts arriving from ERP, MES, SCADA, PLCs, IoT sensors, WMS, CRM, quality systems, maintenance platforms and supplier feeds. Volumes climb. Pipelines multiply. Semantic models balloon. Teams end up maintaining several databases, ETL tools and reporting layers at once.
That is when the question surfaces: should we migrate from Power BI to Microsoft Fabric? It is the right instinct — but it needs one correction before it can be answered well.
You don't actually migrate away from Power BI
Microsoft Fabric does not replace Power BI. Power BI is a core analytics experience inside Fabric.
The real transition is from a Power BI-centric reporting architecture to a broader Microsoft Fabric data and analytics platform. Microsoft describes Fabric as a unified platform spanning data integration, engineering, data science, warehousing, real-time intelligence and Power BI, with OneLake as the common data foundation.
So the honest question is not "should we leave Power BI?" It is: has our manufacturing data environment become too complex for a Power BI-centric architecture?
The objective is not to replace Power BI. It is to give Power BI a stronger data platform underneath it.
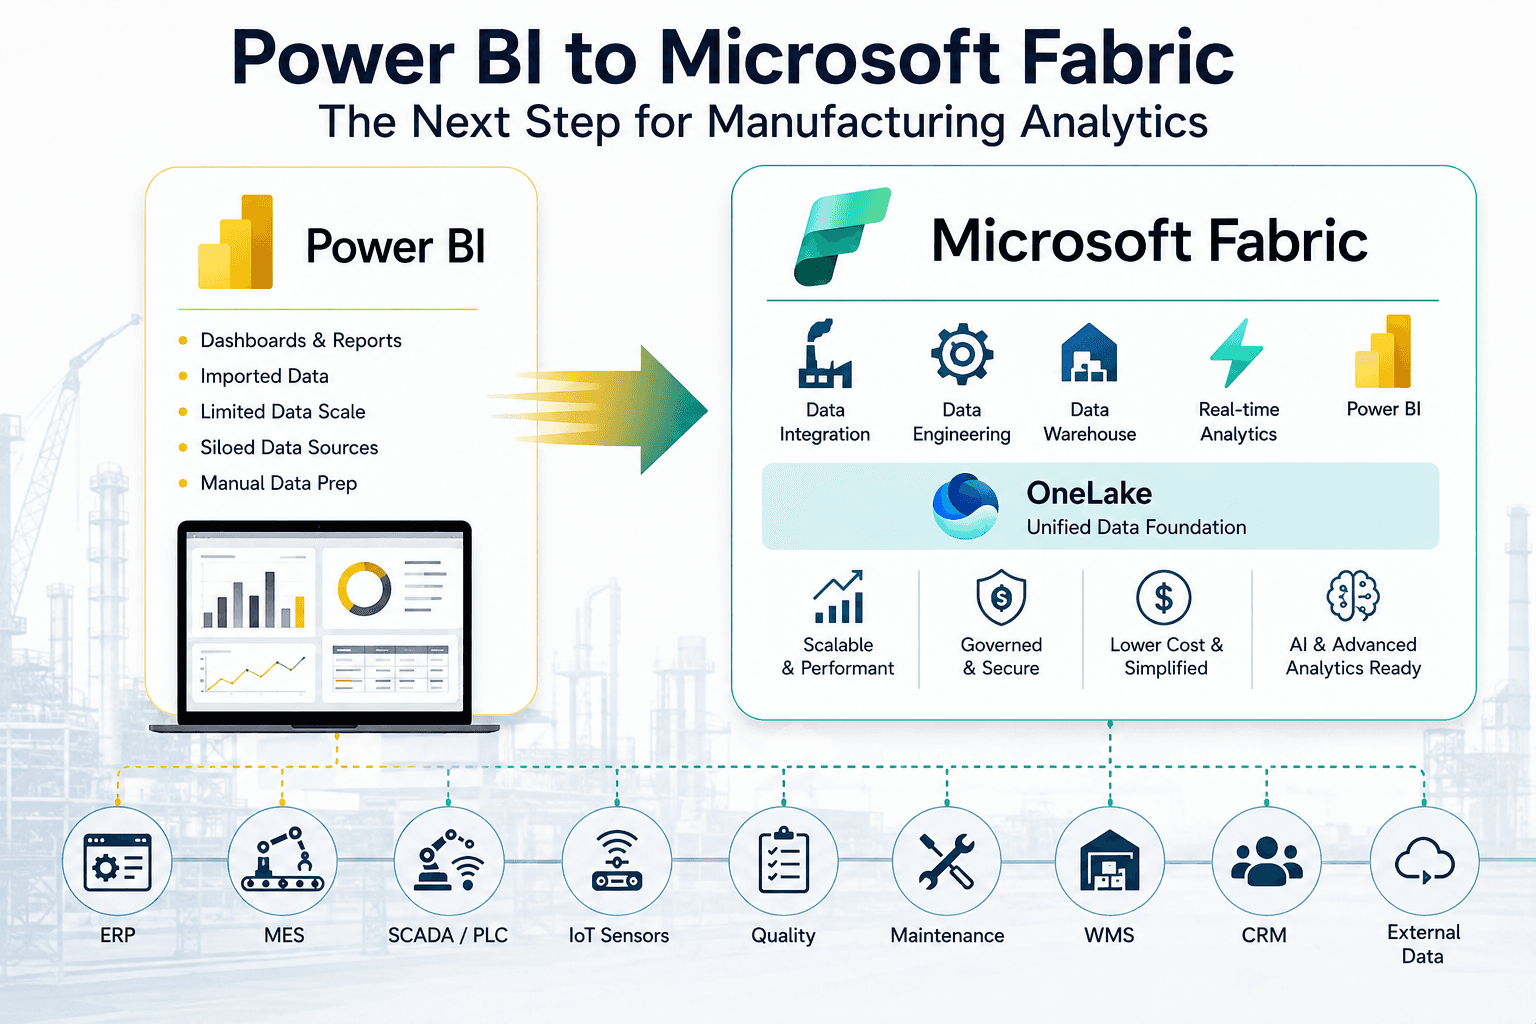
The architecture shift, in plain terms
A traditional manufacturing analytics estate flows one way: ERP, MES, WMS, CRM and Excel feed an ETL or SQL layer, into a data warehouse, into a Power BI semantic model, into Power BI. For a small or moderately complex plant, that works well.
As the business grows, the same shape gets hard to scale, expensive to maintain, heavy on ETL, dependent on duplicated data, hard to govern, and awkward when you try to bring in OT data or support AI.
A broader Fabric architecture rearranges the plumbing: ERP, MES, SCADA/PLC, IoT, WMS and CRM land through Fabric Data Factory into OneLake, refine through a Bronze, Silver and Gold medallion architecture, then serve a Lakehouse and Warehouse, Power BI semantic models, and — from the same governed foundation — BI, AI/ML and real-time intelligence. Same Power BI at the top; a very different platform beneath it.
1. Your data volume is growing fast
Manufacturing generates data at every level — machine to PLC to SCADA to MES to ERP — and then multiplies it across plants, lines, machines, shifts, products, inspections, maintenance events and inventory transactions. Thousands of records become millions, then billions.
When Power BI models start leaning hard on large imports, complex refresh schedules, incremental refresh, aggregation tables and heavy Power Query, that is the platform straining. Fabric's OneLake gives a common data foundation, and Direct Lake lets Power BI semantic models read Delta tables in OneLake directly for supported scenarios — Microsoft positions it specifically for large data volumes. The aim is not "more scale" for its own sake; it is cutting needless movement and duplication while building a stronger analytical base.
2. Your ERP, MES, IoT and OT data sit in silos
This is one of the strongest signals in manufacturing. ERP holds production orders, inventory, purchasing, finance, customers and suppliers. MES holds execution, machine activity, quantities, cycle times and scrap. The OT layer holds PLC data, machine states, temperatures, pressures, speeds and sensor readings. Quality holds defects, inspections and non-conformances. Maintenance holds work orders, downtime and spare parts.
The value shows up only when these can be analysed together: does downtime correlate with quality defects? Which machines drive the biggest production losses? Which products scrap the most? How does maintenance move OEE? What is the financial cost of a stopped line? That is no longer a dashboard problem — it is a data integration problem, and it is the one a Power BI-centric setup handles worst.
3. Power BI has quietly become your ETL platform
Power BI is excellent for semantic modelling and analytics. The warning sign is when too much data engineering creeps into Power Query — ERP, MES, Excel, SQL, CSV and API sources all funnelled through Power Query into one enormous dataset per report.
It feels fast at first. Then refreshes slow down, transformations get hard to manage, business logic gets duplicated, lineage blurs, different reports transform the same data differently, and reusable data assets become almost impossible to build. The fix is to move data engineering upstream — sources into Fabric Data Factory, into OneLake, through Bronze, Silver and Gold, then into a clean semantic model — so there is a real separation between data engineering and business intelligence.
4. You need more than dashboards
Manufacturing analytics is moving from descriptive toward predictive and prescriptive. Descriptive tells you production was 7% below target. Diagnostic tells you Line 3 lost 4.5 hours to unplanned downtime. Predictive tells you machine vibration signals a rising probability of failure. Prescriptive tells you to schedule maintenance before the next cycle.
The further along that curve you go, the more the platform underneath matters. Fabric brings data engineering, data science, machine learning, warehousing, real-time intelligence and Power BI together in one place. For a manufacturer building predictive maintenance, demand forecasting or quality prediction, that consolidated foundation stops being a convenience and starts being the thing that makes the projects feasible.
5. Your IT and OT data need to come together
Manufacturers have long run two separate worlds. IT owns ERP, CRM, finance, HR and supply chain. OT owns PLCs, SCADA, sensors, machines and production lines. The opportunity is connecting them.
A single analytical model that ties machine, production order, product, operator, maintenance event, quality inspection, customer order and inventory together lets you analyse the whole process instead of one system at a time. That is what makes OEE optimisation, predictive maintenance, bottleneck analysis, quality root-cause work, production scheduling, inventory optimisation, energy analytics and a genuine supply chain control tower possible.
6. Your data team maintains more than it builds
Ask your data team two questions. How much time goes into building new analytics? How much goes into fixing pipelines, refresh failures, SQL jobs, data duplication and legacy reports? When the second number keeps growing, the architecture is holding the team back.
The usual symptoms: hundreds of ETL pipelines, duplicate transformations, multiple copies of the same data, manual preparation, fragile Power BI refreshes, tangled dependencies, poor lineage and rising SQL maintenance. Fabric will not fix any of that on its own — but a migration is the moment to redesign the architecture instead of bolting one more layer onto it.
7. You are preparing for AI
This is the most strategic trigger. Manufacturers are exploring predictive maintenance, AI quality prediction, demand forecasting, production optimisation, computer vision, anomaly detection, natural-language analytics and AI agents.
Every one of those needs a strong data foundation — reliable, governed, integrated, historical data with business context. When data is scattered across ERP, MES, SQL, Excel, Power BI and several platforms, every AI project turns into a data integration project first. Fabric gives a single platform across data engineering, data science, real-time intelligence, warehousing and Power BI, so the AI work starts from a foundation instead of rebuilding one each time.
Power BI vs Fabric: when to make the call
The trigger is not that Fabric is newer. It is that the business has outgrown the current architecture. A practical read:
| Your situation | Recommendation |
|---|---|
| Few data sources | Stay on Power BI |
| Simple transformations | Stay on Power BI |
| Small or moderate volumes | Power BI likely enough |
| Many ERP/MES/IoT sources | Evaluate Fabric |
| Large data volumes | Evaluate Fabric |
| Complex ETL environment | Evaluate Fabric |
| Power BI becoming an ETL platform | Consider Fabric |
| Need real-time analytics | Consider Fabric |
| Need AI/ML at scale | Consider Fabric |
| Need a unified enterprise data platform | Strong Fabric candidate |
| Heavy data-platform technical debt | Consider Fabric modernisation |
Migrate because you have outgrown the architecture — not because a platform is fashionable.
What happens to your existing Power BI reports
The biggest misconception is that moving toward Fabric means throwing away Power BI. It does not — Power BI stays central to the target. Existing assets are assessed one by one, and each gets a verdict:
- Keep — business-critical reports that already perform well
- Optimise — reports with weak DAX, modelling or performance
- Consolidate — duplicate dashboards and semantic models
- Rebuild — reports sitting on fundamentally poor data models
- Retire — unused or obsolete reports
The same five-way assessment applies to pipelines, databases, data models, ETL jobs and data sources. Nothing moves just because it exists.
Direct Lake: why manufacturers should pay attention
For large manufacturing datasets, Direct Lake is one of the Fabric capabilities worth evaluating. It lets Power BI semantic models work against Delta tables in OneLake rather than importing all the data into the model — so production data flows OneLake to Delta tables to a Direct Lake semantic model to Power BI.
It is not a magic performance button, though. Microsoft recommends evaluating the specific workload — including Direct Lake considerations and limitations — and prototyping where it matters. Your semantic-model design, data architecture, security requirements and workload patterns still decide whether it pays off.
A manufacturing Fabric readiness scorecard
Score one point for every statement that is true of your organisation.
- Data — multiple ERP/MES/WMS/CRM systems; a need to combine ERP and MES; a need for machine or IoT data in analytics; rapidly growing history
- Power BI — very large semantic models; refreshes hard to manage; many duplicated models; Power Query doing heavy data engineering
- Engineering — a large number of ETL pipelines; data duplicated across platforms; lineage hard to trace; a team spending much of its time maintaining pipelines
- Advanced analytics — you want predictive maintenance; you need real-time analytics; you are exploring machine learning; you are implementing AI
- Governance — departments using different KPI definitions; trouble identifying authoritative data; unclear data ownership; rising security and lineage requirements
| Score | What it means | Where to start |
|---|---|---|
| 0–5 | Power BI may still be enough | Power BI optimisation, modelling, semantic-model governance, data quality |
| 6–10 | Complexity is showing | A Fabric readiness assessment plus a pilot |
| 11–16 | Strong Fabric candidate | A structured Fabric migration roadmap |
| 17+ | Bigger than Power BI | A data modernisation programme across architecture, integration, lake, warehouse, semantic layer, governance and AI |
A phased strategy beats a big-bang migration
For most manufacturers, phased beats big-bang. Assess first — inventory sources, databases, pipelines, semantic models, reports, dependencies, users, capacity and cost. Architect next — the OneLake strategy, the Lakehouse/Warehouse split, data layers, security, governance and the semantic-model approach. Pilot a meaningful workload — Production plus OEE, or Inventory plus Supply Chain, or Quality plus manufacturing performance. Modernise the selected workloads — legacy ETL onto Fabric Data Factory, the data lake onto OneLake, the warehouse onto a Fabric Warehouse or Lakehouse, and Power BI datasets into modern semantic models. Then scale through controlled waves.
That sequence is the manufacturing-specific version of our eight-stage Fabric migration framework — assess, discover, architect, prioritise, migrate, validate, optimise, govern. The principle running through it is the same: don't migrate everything, modernise what matters, retire what doesn't, build for the future.
Done well, the Fabric foundation then carries the whole analytics estate — production analytics (OEE, throughput, cycle time), quality analytics (first-pass yield, scrap, rework), supply chain analytics (OTIF, inventory, supplier performance), maintenance analytics (MTBF, MTTR, predictive maintenance) and executive analytics (plant performance, cost, margin, working capital) — on one governed platform rather than a patchwork.
The bottom line
The question was never "should we replace Power BI with Microsoft Fabric?" Power BI stays part of Fabric. The better question is whether your manufacturing data environment has outgrown a Power BI-centric architecture.
If you are trying to connect ERP, MES, IoT, quality, maintenance, WMS, supply chain and finance while also preparing for AI, predictive analytics and real-time intelligence, it is worth evaluating Fabric. Not to replace Power BI — to give it a platform strong enough for what comes next.
Before migrating, assess. Before rebuilding, architect. Before scaling, govern. Before investing in AI, modernise the data foundation.
The cleanest way to know which side of the line you sit on is to score your estate honestly and pilot one workload end-to-end — Production plus OEE, say — before committing to anything larger. Book a Fabric readiness assessment with Amit — no slides, no pitch deck, no obligation to proceed. You will leave knowing whether Power BI is still enough, and if not, exactly where a Fabric foundation earns its keep.
Free Assessment
Where does your operation sit on the data maturity curve?
8 questions. 3 minutes. You get a scored breakdown across data infrastructure, analytics readiness, and automation potential — with a specific next step for your industry.